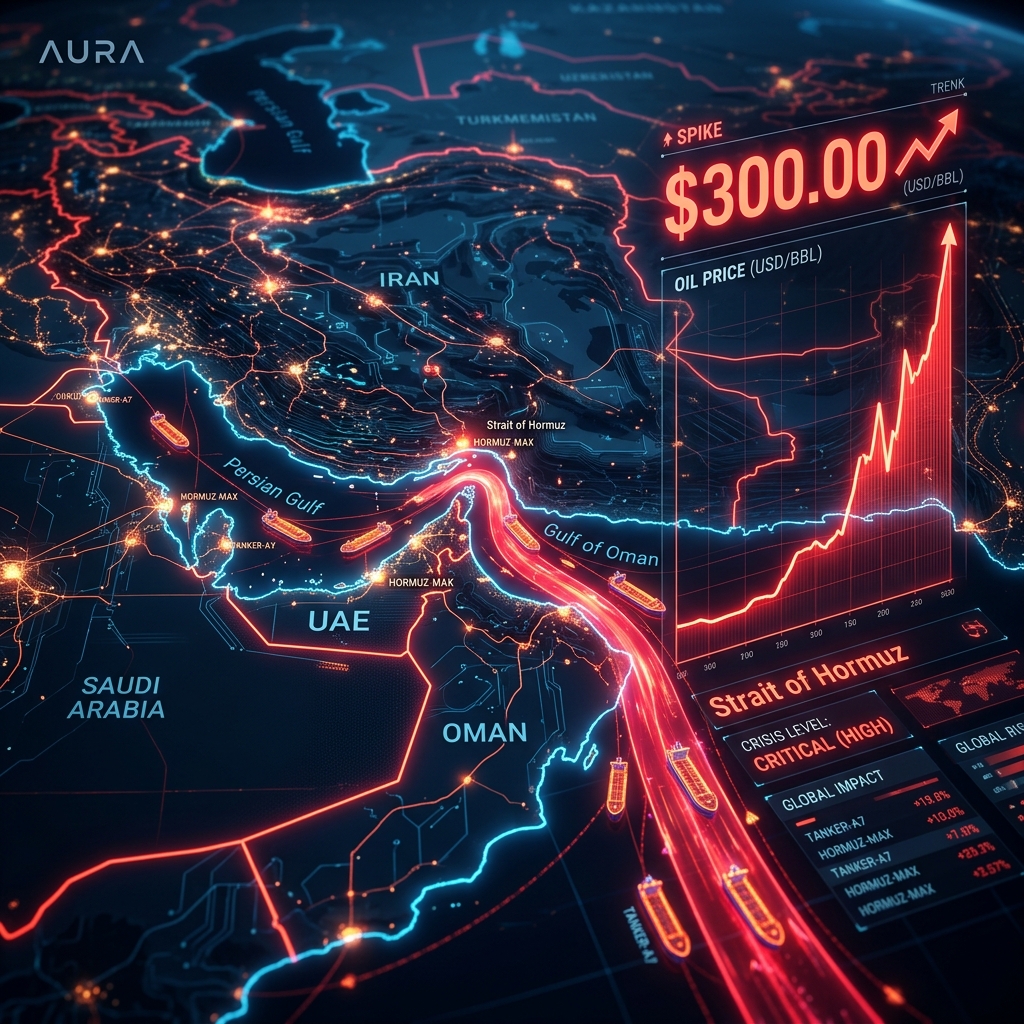
🔥 Mid-2026 Hormuz Disruption Metrics
- Daily Volumetric Flow: Approximately 21 million barrels per day (bpd) of crude and refined products transit the strait, representing 20% of global petroleum consumption.
- LNG Bottleneck: Over 20% of global Liquefied Natural Gas (LNG), primarily from Qatar, relies entirely on this single waterway.
- The Cape Penalty: Rerouting tankers around the Cape of Good Hope adds 10 to 14 days of transit time and up to $2.2 million in extra fuel and charter costs per voyage.
- Insurance Risk Premium: War-risk insurance premiums for transit through the Persian Gulf have surged by 450% in Q2 2026.
The Strait of Hormuz is widely regarded as the most critical maritime choke point in the global energy infrastructure. Measuring just 21 miles wide at its narrowest point—with shipping lanes only two miles wide in either direction—the strait is the solitary marine gateway for oil and gas exporting giants like Saudi Arabia, Iraq, the UAE, Kuwait, and Qatar. While previous geopolitical skirmishes caused temporary price spikes, mid-2026 telemetry and predictive supply-chain modeling show that a prolonged, militarized disruption would trigger unprecedented structural shocks to the global economy.
Building on our initial March 2026 US-Iran energy models, the Data Feed analytics team has synthesized updated shipping registries, war-risk insurance premiums, and strategic petroleum reserve (SPR) drawdowns. Our analysis outlines three distinct escalation scenarios, charting their direct impact on crude prices, logistics networks, and global inflation.
1. The Three Escalation Scenarios: Modeling the Shock
To understand the potential path of Brent and WTI crude, we modeled three distinct operational scenarios in the strait based on current regional naval deployments and kinetic capabilities.
| Scenario Profile | Supply Disruption (bpd) | Projected Brent Price (USD/bbl) | Global Shipping Impact |
|---|---|---|---|
| Scenario 1: "Low-Friction Friction" Harassment, minor drone strikes, localized boarding actions. | 1.5M – 2.5M bpd | $105 – $115 | Inbound tankers experience 2-3 day delays; war-risk premiums rise 50%. |
| Scenario 2: "The Shadow Blockade" Active naval mining, drone swarms targeting tankers, partial channel closure. | 5.0M – 8.0M bpd | $140 – $160 | 35% of tankers reroute around Africa; insurance premiums surge 300%; dry bulk rates spike. |
| Scenario 3: "Chokehold" Total militarized closure of the strait; destruction of port facilities. | 18.0M – 21.0M bpd | $280 – $320 | Complete maritime halt; insurance coverage withdrawn; global supply chains enter triage mode. |
Scenario 1: "Low-Friction Friction" (The Baseline)
In this scenario, localized skirmishes and minor drone strikes lead to intermittent delays. While the physical flow of oil is only marginally reduced, the psychological impact on the market is immediate. The "geopolitical risk premium" is repriced, instantly pushing Brent crude above $100 per barrel. Oil companies and trading desks begin hoarding physical inventories, creating a localized supply squeeze despite stable global production. While manageable, this scenario establishes a high floor for energy costs, feeding directly into persistent core inflation.
Scenario 2: "The Shadow Blockade" (The Logistics Tax)
A partial closure of the strait, enforced by naval mining or persistent drone threat, forces a major logistical pivot. Tankers are forced to bypass the Persian Gulf entirely, forcing oil-producing nations to rely on cross-country pipelines (such as Saudi Arabia’s East-West Pipeline or the UAE’s Habshan-Fujairah pipeline). However, these pipelines have a combined capacity of less than 8.5 million bpd, leaving over 12 million bpd stranded.
The resulting shortfall forces Asian and European refiners to bid aggressively for West African, North Sea, and American sweet crude. This logistical scramble triggers a massive spike in tanker charter rates. The redirection of shipping lanes to the Cape of Good Hope increases global tanker demand (measured in ton-miles) by approximately 30%, creating a secondary supply-chain shock reminiscent of the South China Sea shipping blockade earlier this year.
Scenario 3: "Chokehold" (The $300 Reality)
A total, militarized closure of the Strait of Hormuz is the ultimate black swan event for global energy markets. Under this scenario, 20% of the world’s liquid energy supply vanishes overnight. The shock cannot be offset by OPEC spare capacity or the U.S. Strategic Petroleum Reserve, which has already been depleted by previous interventions.
Without the Persian Gulf's supply, global oil inventories would deplete at an unsustainable rate of 12-15 million barrels per day. Prices would spike violently toward the $300 mark, a level designed not to balance supply and demand, but to force immediate, demand-side destruction. In this environment, hyper-inflation sweeps through agricultural, industrial, and transportation sectors. The economic contagion spreads rapidly, accelerating the supply chain collapse of semi-finished goods and triggering a severe global recession.
2. The Rerouting Penalty: The Cape of Good Hope Bypass
For tankers unable or unwilling to brave the Persian Gulf, the only alternative is the long voyage around the southern tip of Africa. This bypass is not merely a geographic inconvenience; it is an economic penalty that reshapes the profitability of global trade. A standard Very Large Crude Carrier (VLCC) carrying 2 million barrels of oil traveling from Ras Tanura (Saudi Arabia) to Rotterdam (Netherlands) faces a stark logistical choice:
- Standard Route (via Suez Canal): ~6,400 nautical miles, taking roughly 18 days.
- Bypass Route (via Cape of Good Hope): ~11,300 nautical miles, taking roughly 32 days.
This 14-day extension requires an additional 500 metric tons of marine fuel, costing approximately $450,000 at mid-2026 bunker prices. When factored alongside daily vessel charter rates (which spike from $60,000 to over $180,000 per day during maritime crises) and ballooning hull insurance, the total cost of a single voyage increases by $2.2 million. This "logistics tax" is passed directly to the consumer, manifesting as higher prices at the pump and increased manufacturing costs worldwide.
3. Macroeconomic Fallout: Global GDP & Inflation
The relationship between energy shocks and economic recessions is historically robust. A sustained oil price of $150/bbl (Scenario 2) is estimated to shave 1.2% off global GDP growth while adding 1.8% to global consumer price indexes (CPI). If Scenario 3 occurs and oil breaches $280/bbl, the macroeconomic models indicate a synchronized global recession. Central banks, already battling sticky inflation, would be trapped between raising rates to combat energy-driven inflation or cutting rates to support collapsing industrial output. High energy costs would also act as an accelerant to the ongoing power grid capacity crisis, as utilities scramble to secure coal and natural gas alternatives.
4. Conclusion: Navigating the Vulnerability
The 2026 energy data highlights a sobering reality: despite decades of talk about energy independence and the transition to renewables, the global economy remains tethered to a 21-mile strip of water in the Middle East. While strategic reserves and alternative pipelines offer a temporary buffer, they cannot withstand a prolonged blockade. Investors and policymakers must move past baseline assumptions of stable energy flows and actively price the "Hormuz Risk" into their long-term portfolios. The question is no longer if the strait is vulnerable, but how quickly the global supply chain can adapt when the choke point finally closes.
Frequently Asked Questions
How long could the U.S. and allies sustain oil supply using Strategic Reserves?
As of mid-2026, the combined Strategic Petroleum Reserves (SPR) of IEA member countries stand at approximately 1.2 billion barrels. In the event of a complete Hormuz shutdown (losing 21M bpd), these reserves could theoretically cover the deficit for roughly 60 to 90 days if coordinated perfectly, though logistical bottlenecks would limit daily withdrawal rates to around 8 million bpd.
Can land-based pipelines completely bypass the Strait of Hormuz?
No. The combined capacity of all operational bypass pipelines (such as the Saudi East-West Pipeline and the Abu Dhabi Crude Oil Pipeline) is roughly 8.5 million bpd. Even if operated at 100% capacity, they can only handle about 40% of the daily volume that currently transits the strait, leaving a deficit of over 12 million bpd.
How would a Strait of Hormuz crisis impact natural gas (LNG) markets?
The impact on LNG would be even more acute than on oil. Qatar, which provides over 20% of the world's LNG, has no bypass pipelines and relies entirely on the strait. A complete blockade would trigger an immediate heating and electricity crisis in Europe and Asia, sending spot LNG prices to record highs and forcing widespread industrial energy rationing.
Related Energy & Geopolitical Intelligence
- Will Oil Hit $300? Data Analysis of the March 2026 US-Iran Conflict Scenarios
- South China Sea Shipping Blockade: 2026 Data on Why Freight Costs Rose 400%
- Supply Chain Contagion: Why the 2026 Gulf War Halted 60% of Semi-Finished Goods
- The 2026 Power Grid Crisis: Why EV Adoption Is Outpacing Infrastructure